It only took a handful of months for the U.S. economy to reel from COVID-19’s effects.
As unemployment rates hit all-time highs and businesses scrambled to stay afloat, new data shows that current dollar GDP plummeted from nearly $21.6 trillion down to $19.5 trillion between Q1’2020 and Q2’2020 (seasonally adjusted at annual rates).
While all states experienced a decline, the effects were not distributed equally across the nation. This visualization takes a look at the latest data from the Bureau of Economic Analysis, uncovering the biggest declines across states, and which industries were most affected by COVID-19 related closures and uncertainty.
Change in GDP by State and Industry
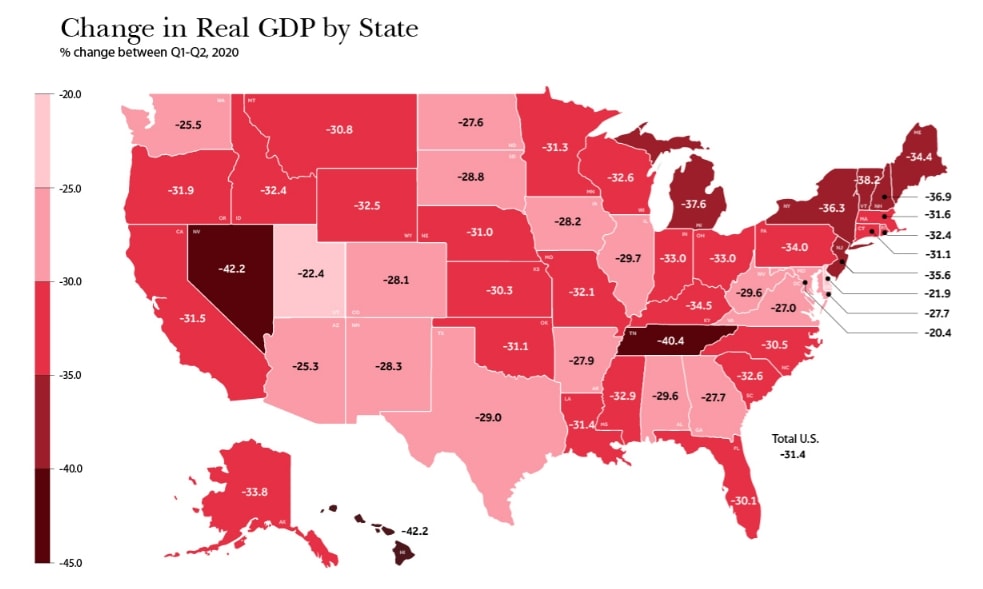
Between March-June 2020, stay-at-home orders resulted in disruptions to consumer activity, health, and the broader economy, causing U.S. GDP to fall by 31.4% from numbers posted in Q1.
The U.S. economy is the sum of its parts, with each state contributing to the total output—making the COVID-19 decline even more evident when state-by-state change in GDP is taken into consideration.Search:
(p.p.)Alabama-29.6Durable Goods Manufacturing-5.02Alaska-33.8Transport and Warehousing-9.43Arizona-25.3Accommodation and Food Services-4.2Arkansas-27.9Health […]