The 118th Congress achieved a variety of demographic milestones when its members took office in January. Generation Z is now represented in the national legislature, while Vermont sent a female lawmaker to Capitol Hill for the first time. Still, Congress remains out of step with the broader U.S. population by several demographic measures.
Here are eight charts that show how the profile of Congress has changed over time, using historical data from CQ Roll Call, the Congressional Research Service and other sources.
How we did this
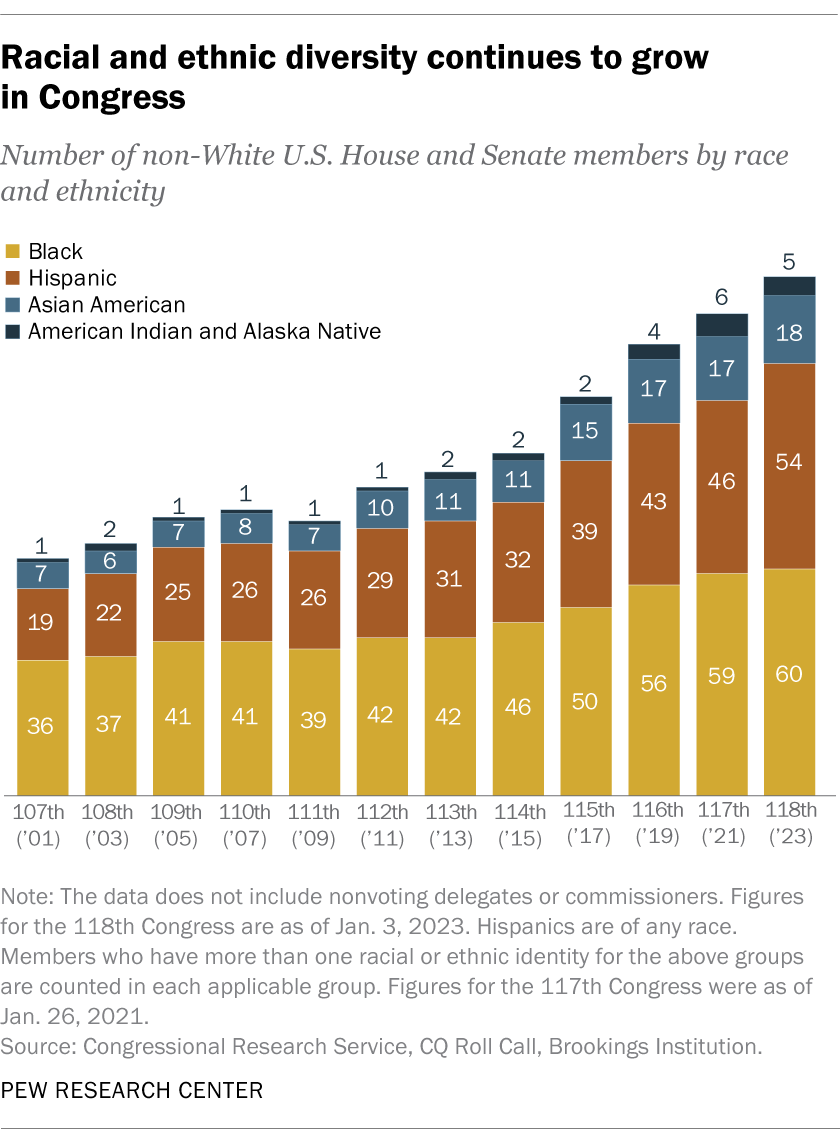
The 118th Congress is the most racially and ethnically diverse in history. Overall, 133 lawmakers identify as Black, Hispanic, Asian American, American Indian, Alaska Native or multiracial. Together, these lawmakers make up a quarter of Congress, including 28% of the House of Representatives and 12% of the Senate. By comparison, when the 79th Congress took office in 1945, non-White lawmakers represented just 1% of the House and Senate
Despite this growing racial and ethnic diversity, Congress remains less diverse than the nation as a whole. Non-Hispanic White Americans account for 75% of voting members in the new Congress, […]